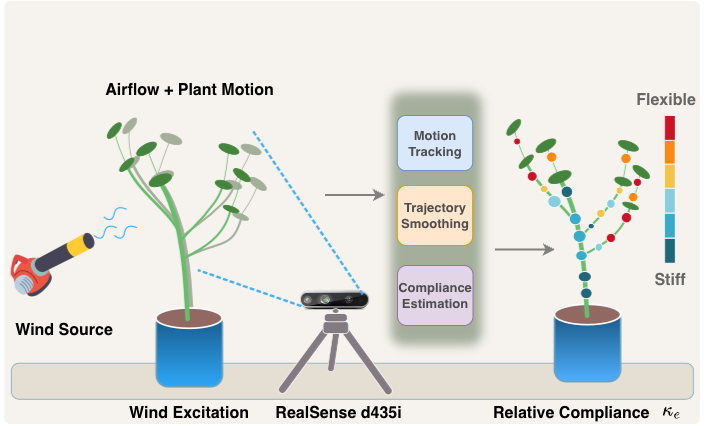
Compliance heatmap overlaid on a wind-excited plant branch, estimated from the full video sequence. Blue = stiff, Red = compliant.
Vision-based quantification of the mechanical properties of plant branches before manipulation can be valuable for automated horticulture tasks. Efficient manipulations cannot avoid collisions, and stiff contact with the plants can harm them, slowing down the robot. Therefore, gaining awareness of a plant's mechanical compliance will be an asset for many downstream plant-handling and monitoring tasks, such as flower picking or selective harvesting of fruits and vegetables. This is fundamentally challenging because estimating properties such as stiffness requires force measurements, which are unreliable, expensive, and time-consuming to collect at scale.
We propose using artificial wind as excitation to estimate the relative compliance that captures how much each branch segment bends compared to its neighbors. Our vision-based pipeline tracks points on the branch, smooths their trajectories, and estimates per-segment compliance from the resulting bending signals. We estimate the uncertainty of our measured compliance using a moving-block bootstrap, which quantifies the stability of the estimate under temporal resampling. Our proof of concept is demonstrated using a monocular video of a wind-excited plant branch over 1104 frames. Our pipeline recovers a proximal-to-distal relative motion gradient and an interpretable relative compliance map, which are consistent with physical expectations.
Graphical Abstract. The monocular video of a wind-excited plant is processed through TAPIR-based tracking and factor-graph trajectory smoothing, which computes and produces the image-plane relative compliance of the plant stem at various nodes. Click image to enlarge.
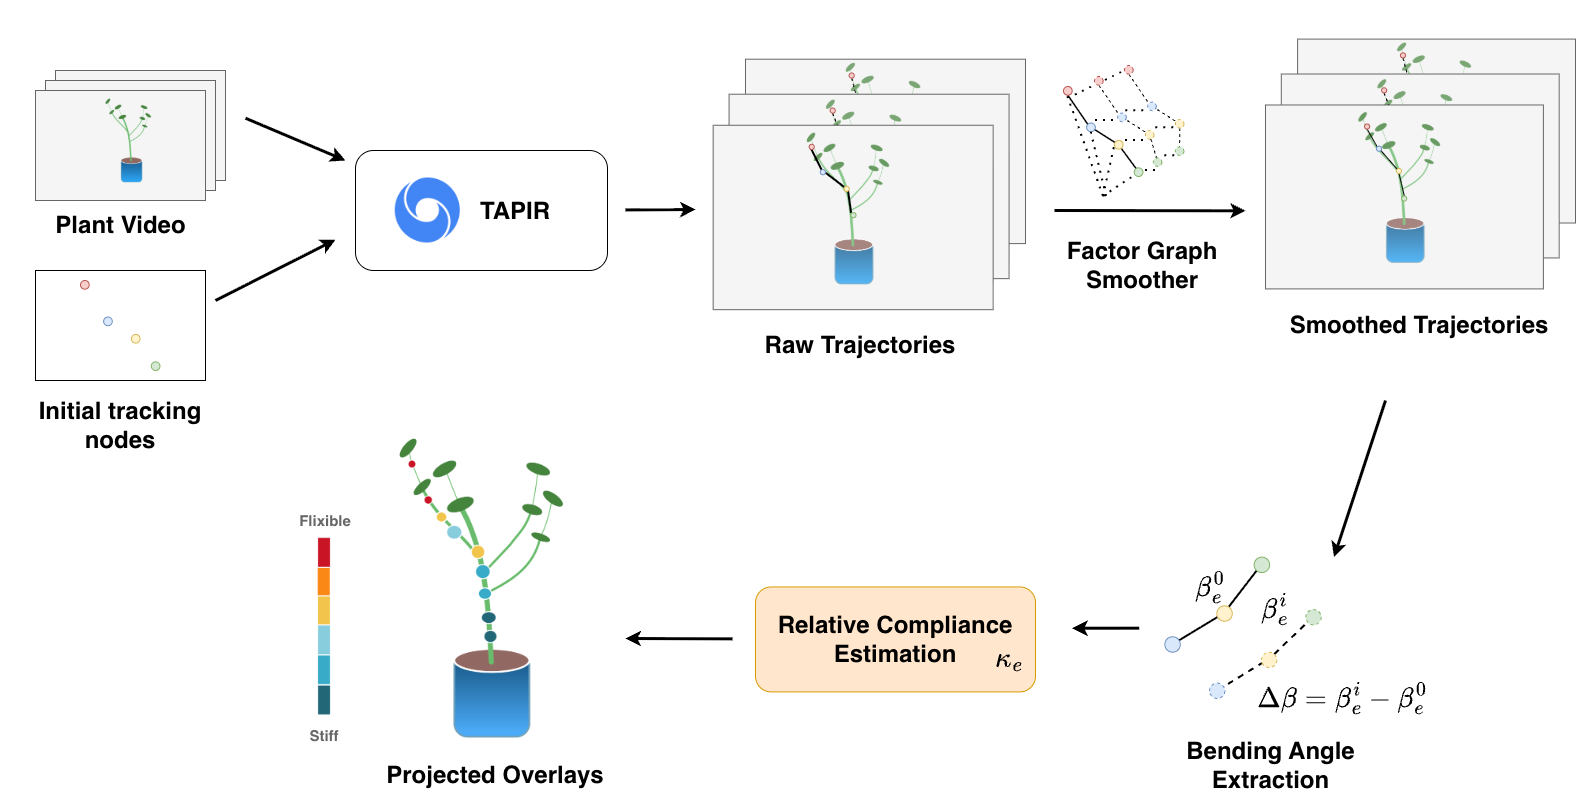
Overall Methodology. Starting from a monocular plant video and annotated initial points, TAPIR generates raw trajectories which are smoothed via factor-graph optimisation. Bending angles are extracted and fed into the compliance estimation model, whose output is projected onto a 3D point cloud reconstructed by monocular depth estimation. Click image to enlarge.
Our three-stage pipeline processes monocular RGB video of a wind-excited plant branch to produce a per-edge relative compliance map with uncertainty estimates:
We validated our pipeline on two separate wind-excited plants. Select a plant to explore the full analysis.
20 nodes · 19 edges · 1104 frames
Annotated branch graph with raw TAPIR trajectories. Tracks are noisy due to pixel noise and brief occlusions.
After factor-graph optimisation. Temporal smoothness and branch inextensibility enforced; geometric noise reduced by ~39% for Plant 1.
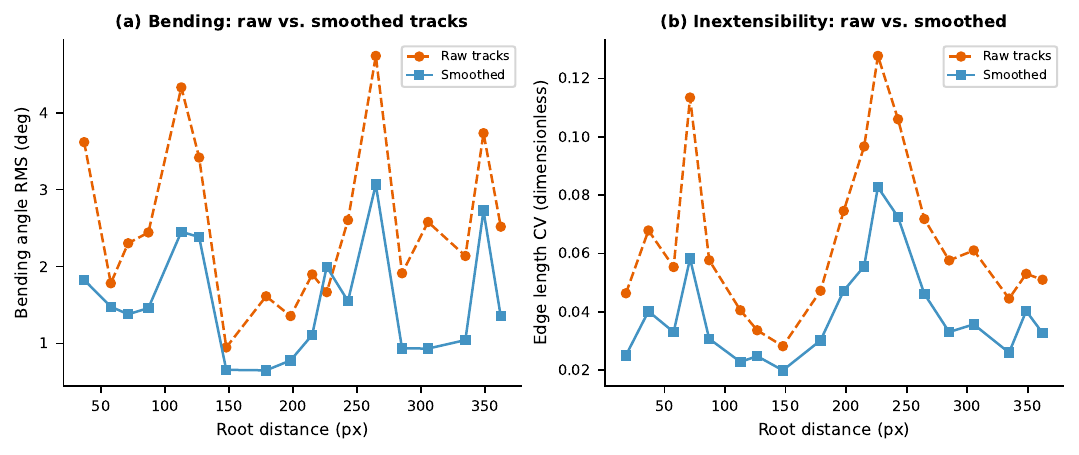
Fig. 4 — Smoothing Comparison. Bending angle RMS (left) and edge-length CV (right) for raw TAPIR (orange) vs. smoothed (blue) tracks. Click to enlarge.
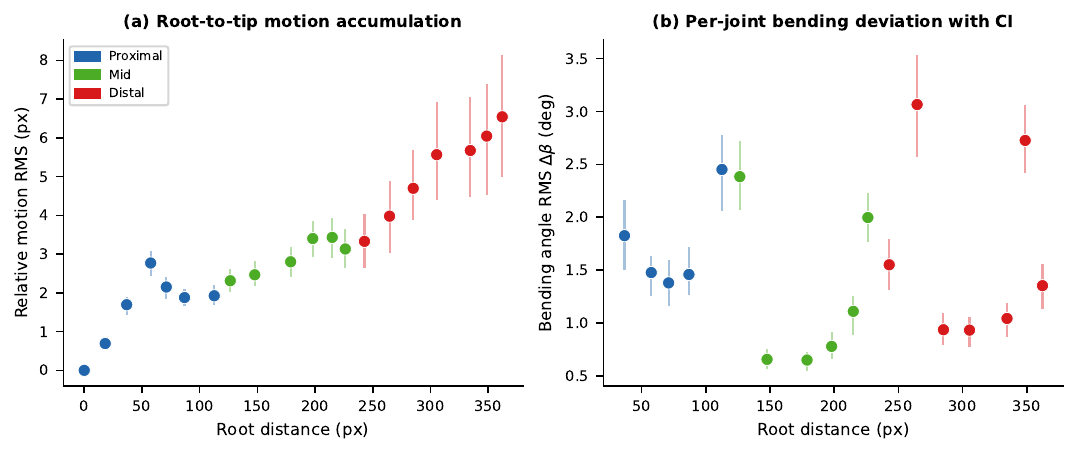
Fig. 5 — Node Motion vs. Root Distance. Per-node displacement amplitude as a function of distance from the root. The proximal-to-distal gradient confirms physically plausible wind-excited dynamics. Click to enlarge.
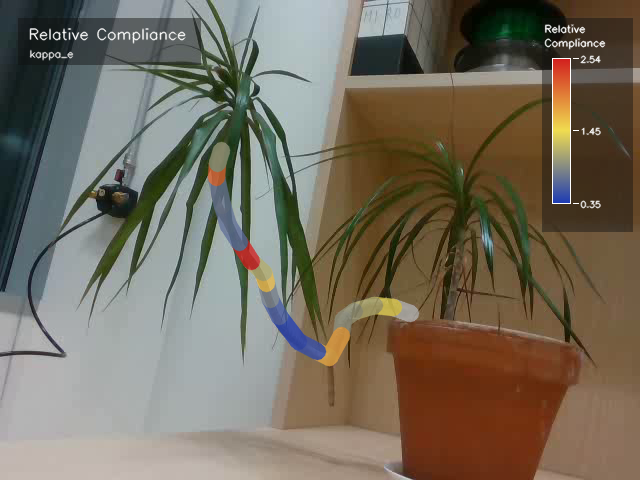
Relative Compliance κe. Blue = stiff, Red = compliant. Click to enlarge.
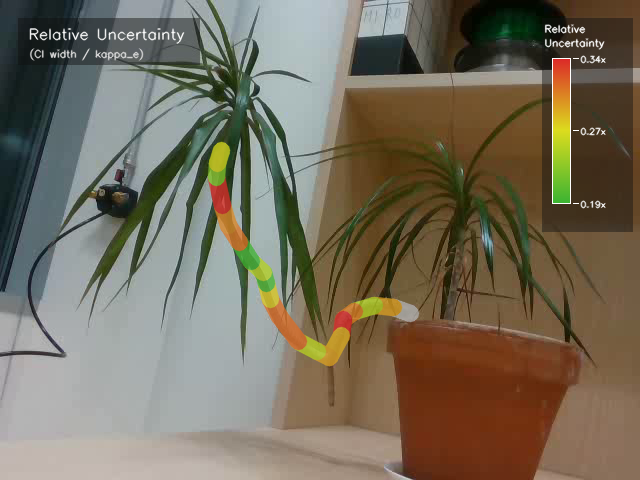
Bootstrap Uncertainty Ue. Green = confident, Red = uncertain. Median Ue = 0.29 (29%). Click to enlarge.
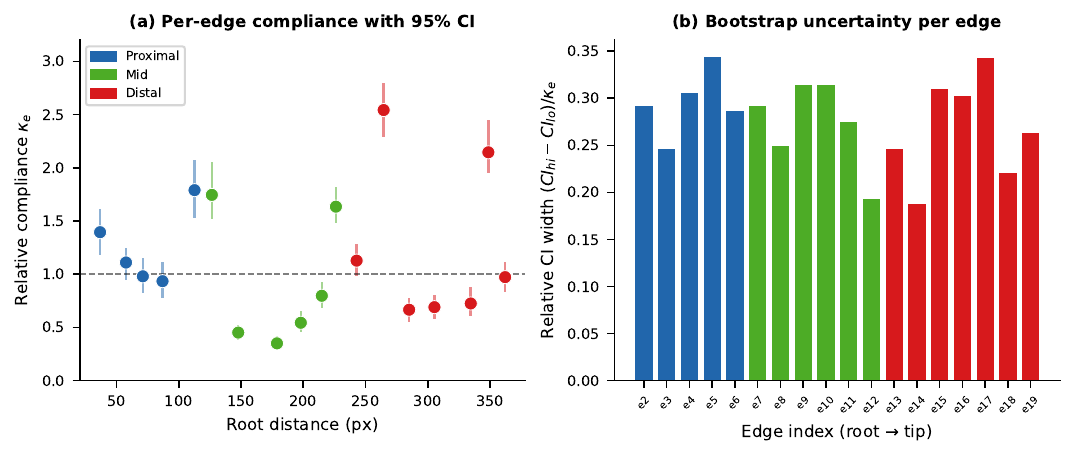
Fig. 6 — Per-Edge Compliance vs. Root Distance. κe per edge with 95% bootstrap CIs. Colours: proximal, mid, distal. The non-monotonic profile shows compliance is not merely motion amplitude. Click to enlarge.
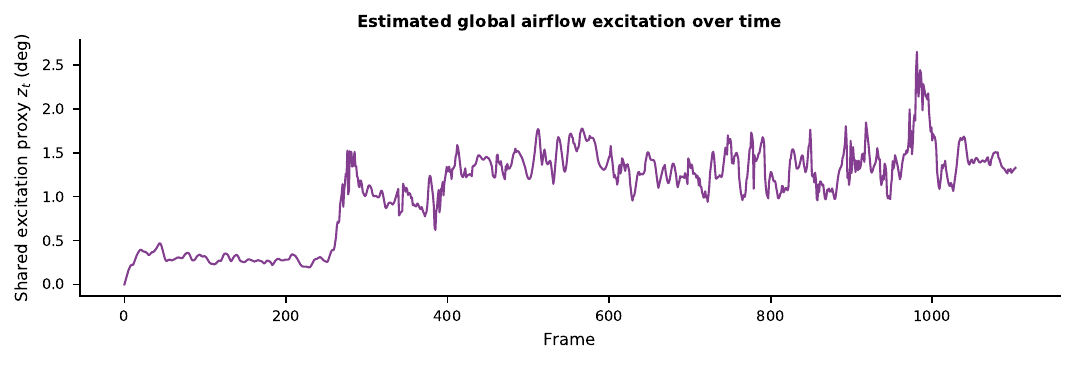
Fig. 7 — Excitation Timeseries. Estimated shared excitation zt over time, showing the wind-driven oscillation used to fit the compliance model. Click to enlarge.
25 nodes · 24 edges · 590 frames
Annotated branch graph with raw TAPIR trajectories on Plant 2. Raw tracks exhibit along-axis spikes up to ~10°, with a mean bending RMS of 4.42° and edge-length CV of 0.077.
After factor-graph optimisation on Plant 2. Bending RMS reduced from 4.42° to 2.11° (~52%) and edge-length CV from 0.077 to 0.044, with no hyperparameter re-tuning.
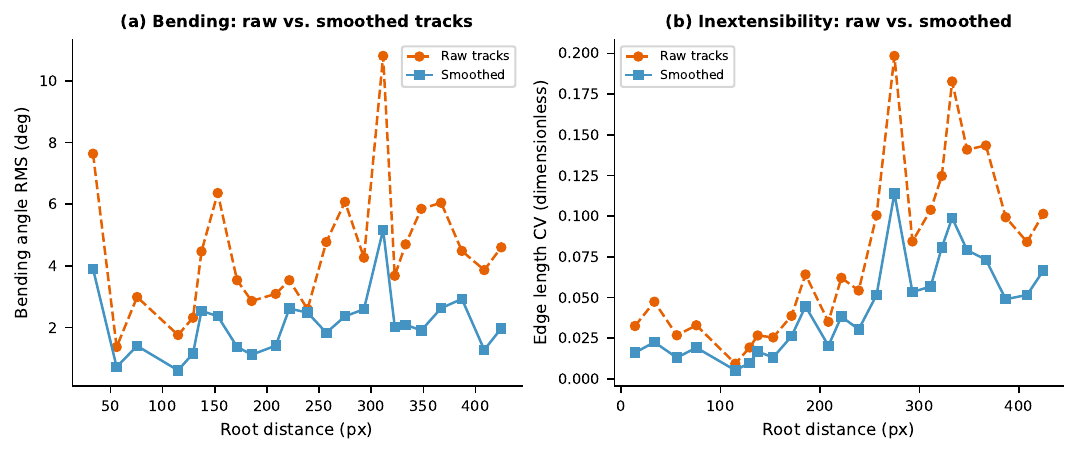
Fig. 4 — Smoothing Comparison (Plant 2). Bending angle RMS (left) and edge-length CV (right) for raw TAPIR (orange) vs. smoothed (blue) tracks. Smoothed tracks show ~52% lower bending noise (4.42° → 2.11°) and CV reduction (0.077 → 0.044), without re-tuning any hyperparameters. Click to enlarge.
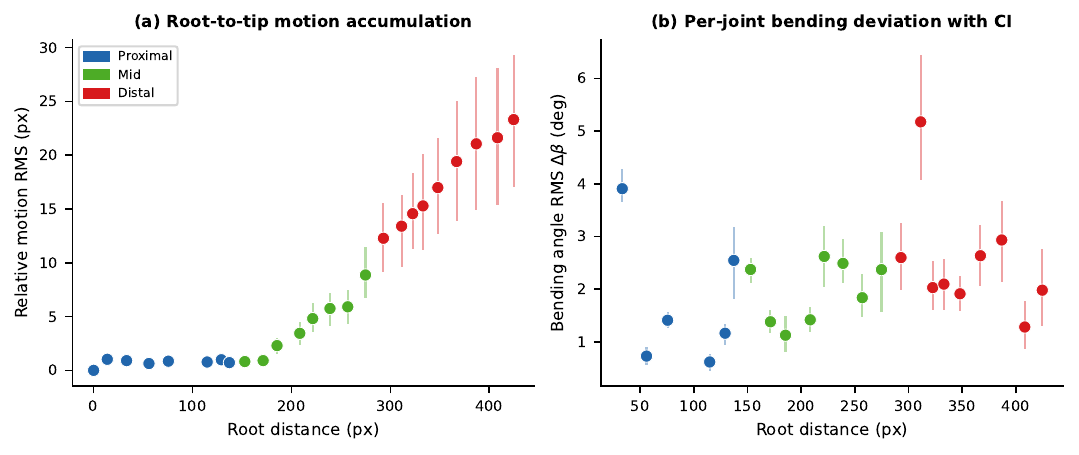
Fig. 5 — Node Motion vs. Root Distance (Plant 2). Per-node displacement amplitude as a function of root distance. Near-monotonic root-to-tip amplification is recovered — the trend is distinctly cleaner than Plant 1 owing to Plant 2's longer lever arm. The largest per-joint bending occurs at edge 17 (distal zone, 5.17° RMS). Click to enlarge.
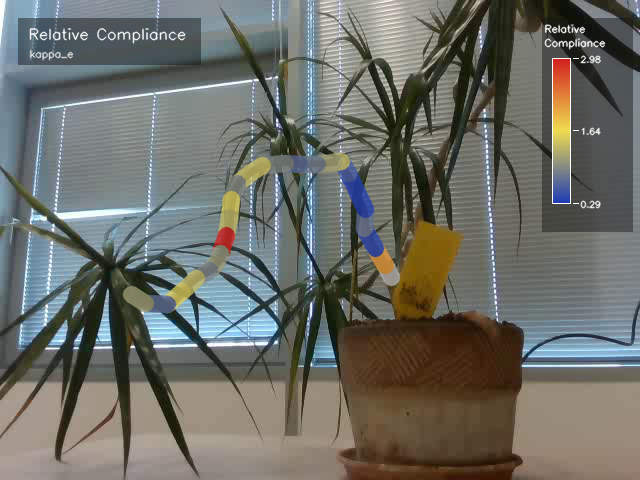
Relative Compliance κe. Most compliant: edge 17 (distal, κe = 2.98); stiffest: proximal edges 3, 5, 6 (κe = 0.29–0.51). Blue = stiff, Red = compliant. Click to enlarge.
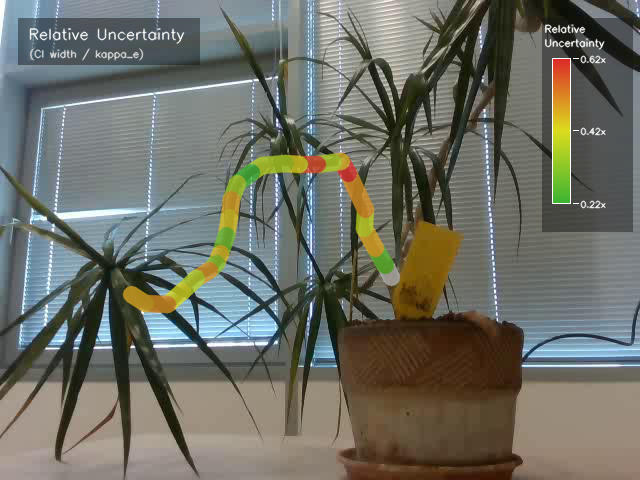
Bootstrap Uncertainty Ue. Median Ue = 0.43 (43%), higher than Plant 1 (29%) due to fewer frames (590) and mid-zone leaf occlusions. Green = confident, Red = uncertain. Click to enlarge.
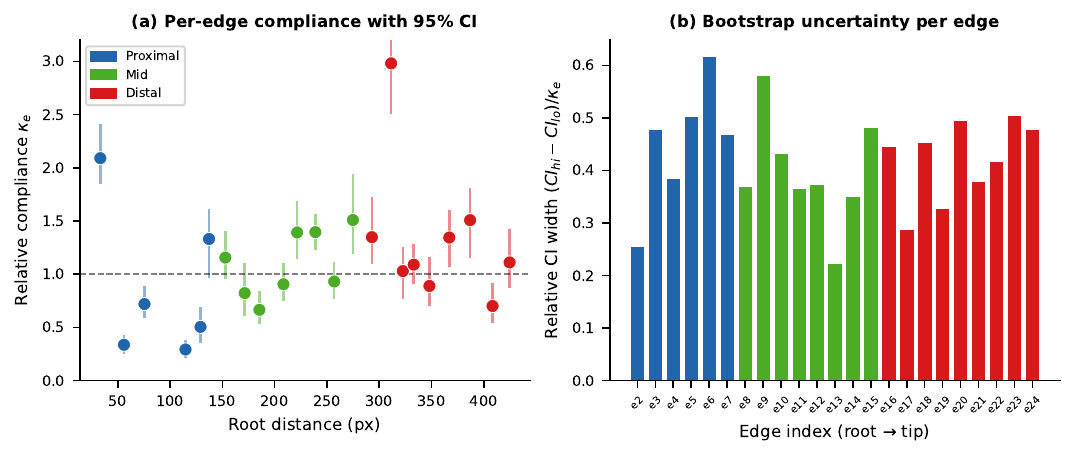
Fig. 6 — Per-Edge Compliance vs. Root Distance (Plant 2). κe per edge with 95% bootstrap CIs. Colours: proximal, mid, distal. Most compliant: edge 17 (distal, κe = 2.98, 573/590 inlier frames); stiffest: proximal zone (edges 3, 5, 6; κe = 0.29–0.51), consistent with clamped-beam boundary conditions near the pot. Click to enlarge.
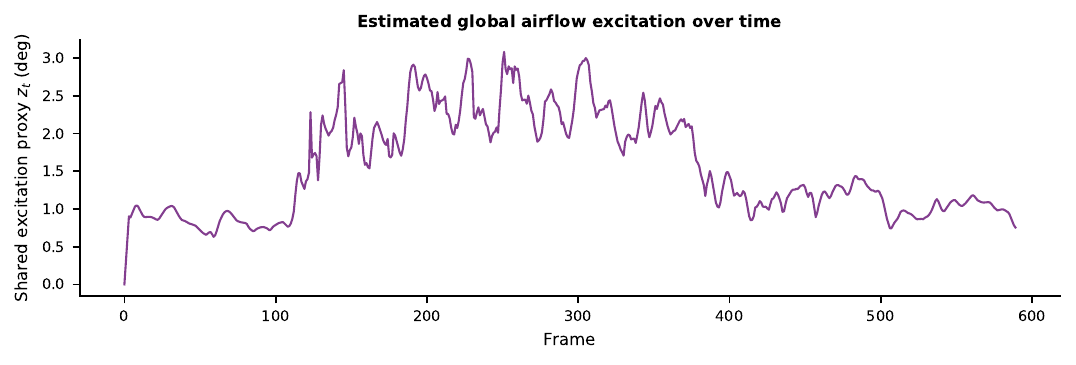
Fig. 7 — Excitation Timeseries (Plant 2). Estimated shared excitation zt over 590 frames, capturing the wind-driven oscillation used to fit the compliance model for Plant 2. Click to enlarge.
Point tracking is powered by TAPIR (Tracking Any Point with per-frame Initialization and temporal Refinement).
Factor-graph optimisation is inspired by GTSAM / factor-graph approaches for dynamics-constrained optimisation.
Uncertainty estimation uses the moving-block bootstrap to handle temporally correlated bending signals.
@inproceedings{bhowmik2026uncertainty,
  title     = {Uncertainty-Aware Relative Compliance Estimation of Wind-Excited Plant from Monocular Video},
  author    = {Bhowmik, Abhimanyu and Behrens, Jan and Babuska, Robert},
  booktitle = {ICRA 2026 Workshop on Uncertainty in Open-World Robotics},
  year      = {2026}
}